Economy

Stretch Limo - Model 2
File: c:/ddc/Angel/BestIntentions/Economy.html
Date: Tue Sep 25 22:08:45 2007
      Thu Jun 05 13:28:54 2008
      Tue Jan 12 20:56:09 2010
(C) OntoOO/ Dennis de Champeaux
Growth for the sake of growth is the ideology of the cancer cell.
(Edward Abbey)
Illegal aliens: the conservatives love their cheap labor; the liberals
love their cheap cause.
(Edward Abbey)
"Sustainable development", a modern oxymoron.
(Anonymous)
What you earn, is a function of what you can learn.
(Bill Clinton)
GDP = consumption + investment +GDP can be used as a coarse metric to compare different nations and to compare short term up and down trends in a nation's economic activities. However, as observed and critiqued by many, the GDP metric has serious flaws. For example [GDP] observes:
(government spending) +
(exports - imports)
GDP counts work that produces no net change or that results from repairing harm. For example, rebuilding after a natural disaster or war may produce a considerable amount of economic activity and thus boost GDP, but it would have been far better if the disaster had never occurred in the first place.A 'fine' example is the destruction in 1900 of Galveston, Texas, by a hurricane. Deaths are estimated around 8000, while the city was obliterated. Most worrisome, however, is that we have not learned from this disaster. The whole Gulf coast, Florida included, has been further developed and nearly every year since then we have major disasters that perversely 'enhance' GDP because we have to fix the damages and bury the deaths. Communities that compete for new correction facilities -- due to increased criminality -- is another example where an increasing GDP is not truly reflecting a nation's well-being.
A 1995 article beats on the same drum [Cobb]:
By the curious standard of the GDP, the nation's economic hero is a terminal cancer patient who is going through a costly divorce. The happiest event is an earthquake or a hurricane. The most desirable habitat is a multibillion-dollar Superfund site. All these add to the GDP, because they cause money to change hands. ...The articles continues with more absurdities:
The strange fact that jumps out from Bennett's grim inventory of crime, divorce, mass-media addiction, and the rest is that much of it actually adds to the GDP. Growth can be social decline by another name. Divorce, for example, adds a small fortune in lawyers' bills, the need for second households, transportation and counseling for kids, and so on. Divorce lawyers alone take in probably several billion dollars a year, and possibly a good deal more. Divorce also provides a major boost for the real-estate industry. "Unfortunately, divorce is a big part of our business. It means one [home] to sell and sometimes two to buy," a realtor in suburban Chicago told the Chicago Tribune. Similarly, crime has given rise to a burgeoning crime-prevention and security industry with revenues of more than $65 billion a year. The car-locking device called The Club adds some $100 million a year to the GDP all by itself, without counting knock-offs. Even a gruesome event like the Oklahoma City bombing becomes an economic uptick by the strange reckonings of the GDP. "Analysts expect the share prices [of firms making anti-crime equipment] to gain during the next several months," The Wall Street Journal reported a short time after the bombing, "as safety concerns translate into more contracts."Rebuilding New Orleans after the Katrina hurricane boosts GDP, while we know for sure that the Gulf Coast will be pummeled again and again. May we remind that 1800 people lost their lives? Other natural disasters have since caused havoc and deaths in the hundred thousands. We call these 'natural disasters' because we are not willing to admit that they are caused by our policies ('justified' by ultimately absurd metrics) yielding an exploding population that is forced to live in more and more dangerous locales with tragic consequences.

The GDP measures the level of activities/ transactional flux in the society instead of actual useful products and services minus costs. Cynically, governments are very keen on GDP since whether the measured activities are good or bad does not matter: they are taxable! Hence a depression with reduced activities is bad news - for a government - and they will do whatever it takes to get the flux going again. The massive redistribution function of welfare state governments suppresses distinguishing between 'good' and 'bad' components of the economic flux. The next metric is an attempt to make that distinction. [To avoid a potential misunderstanding: we do not advocate abandoning GDP, we only propose additional metrics so that the equivalent of profit and loss and net-worth increase and decrease can be measured at the level of nations (and beyond)].
Personal consumption expenditures, Value of housework and parenting, Value of higher education, Value of volunteer work, etc.At the negative side they have entries like:
Cost of crime, Loss of leisure time, Costs of unemployment and under-employment, Cost of commuting, Cost of household pollution abatement, Cost of auto accidents, Cost of water pollution, Cost of air pollution, Cost of noise pollution, Loss of wetlands, Loss of farmland, Loss of primary forest cover, Depletion of non-renewable resources, Carbon dioxide emissions damageA comparison with GDP and their GPI shows a dramatically different perspective on what happened in the 2nd half of the 20th century:
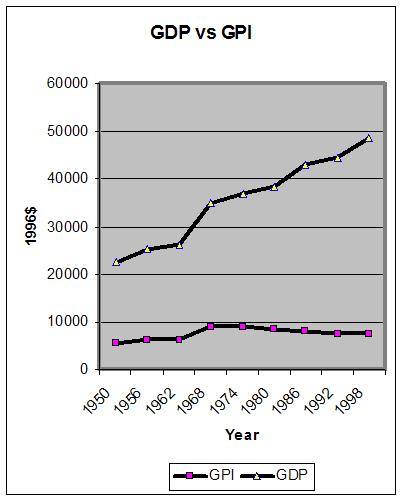
While the Genuine Progress Indicator gets closer to capturing the 'true' situation in a nation's economy (and the trend) by distinguishing whether activities are 'good' or 'bad', there is the flaw that they mix together accounting of income and expense with accounting of assets and debts. The next two sections sketches alternatives.
| Income | Necessary but Unfortunate |
|
Agricultural & Fishing Manufacturing Retail Product Design Mining/ Extraction [other sectors] -----------------------+ [their sum] |
Public Sector Public Education Healthcare Medicare/Medicaid Private sector Healthcare [other sectors] Discretionary Expenditures -----------------------+ [their sum] |
Healthcare was 5% of GDP in 1950; it is 17% of GDP in 2010. That 12% increase has come at the expense of Discretionary Expenditures (while, as discussed before, the quality of healthcare is below that of other countries, who spend way less as a percentage of GDP). Increasing expenditures for social services (affordable housing, food-stamps, school lunches, etc.) due to a more needy citizenry has eaten into Discretionary Expenditures as well. A nation's future depends on theoretical and applied research, which resides under Discretionary Expenditures. A slow, half century decline of Discretionary Expenditures impacts the ability of a nation to safeguard its future. Long term interests start clashing with short term needs; hence one can hear the complaint "Why space research if we have so many problems here and now?"
GDP does not measure the sustainability of growth. A country may achieve a temporarily high GDP by over-exploiting natural resources or by miss-allocating investment. For example, the large deposits of phosphates gave the people of Nauru one of the highest per capita incomes on earth, but since 1989 their standard of living has declined sharply as the supply has run out. Oil-rich states can sustain high GDP's without industrializing, but this high level would no longer be sustainable if the oil runs out. Economies experiencing an economic bubble, such as a housing bubble or stock bubble, or a low private-saving rate tend to appear to grow faster due to higher consumption, mortgaging their futures for present growth. Economic growth at the expense of environmental degradation can end up costing dearly to clean up; GDP does not account for this.We share the concerns in this quote, but blaming GDP (and the other metrics) is 'unfair' -- they are not designed to capture sustainability of a status quo and certainly not of the 'sustainability of growth' in the first sentence of the quote. (An assumption of eternal GDP growth is unrealistic anyway.) Instead, we need a metric that corresponds with a company's yearly balance sheet that shows assets, debts and net-worth/equity.
Replicating a balance sheet for a nation, or better for the world, brings us in uncharted waters. Until very recently in humanity's history the Earth's resources were infinite for all practical purposes because humanity had not yet figured out how to access the finite resources. We were living like other species and we simply used the yearly surpluses delivered by the Sun. Things started to get out of control with slash-and-burn activities, scraping off easy accessible fuels, digging deeper for resources and now we are siphoning away oil and changing the world's climates as a little side effect. Others have used the image of us climbing a ladder and each time breaking off the rung from which we just ascended. Here an attempt to be more precise. Consider a balance sheet, called the NationBalance (or EarthBalance) metric, with the following entries:
| Asset side items: | Debit side items: |
|
Earth's retrievable resources (with current technology) Usable infrastructure (corrected for deterioration, over-use, etc.) Intellectual property (say restricted to patent rights?) Sum of values of all companies on all stock exchanges Other assets -----------------------+ [their sum] |
Capitalized infrastructure maintenance obligations Capitalized environmental cleanup obligations Capitalized obligations for social security & healthcare benefits Other debits Net-worth/equity -----------------------+ [their sum] |
Net-worth/equity is calculated by adding all assets and subtracting all debits.
Completing these lists and monetizing these items is likely a good exercise for obtaining a PhD thesis. From there, we can get the per capita net worth and subsequently its trend. The reward for this exercise is that one gets a first hand insight in consequences of the exponential population explosion we have witnessed since 1900. It will be a healthy antidote to the GDP-metric growths addiction.
Working out the details of this metric is here, in fact, not
necessary. The world economy depends heavily on oil, which is
depleting rapidly on a per capita basis. Here the
back-of-the-envelope argument:
-- The world's resources, among which oil, is fixed and finite
-- The world's population was roughly constant before 1900 but was
4-times as large in 2000
-- The world's economy become addicted on oil in the 20th century and
half of it (accumulated during 500,000,000 years) was consumed by 2000
Hence a person's heritage to the planet's oil in 2000 was 1/8 of a person in 1900.
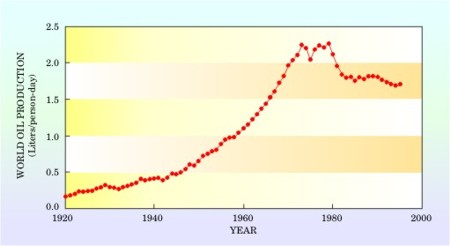
World daily production of petroleum per capita has been steadily dropping since the 1970s, when it was roughly 2 liters per person-day. Currently, US consumption is about 4 liters per person-day. As petroleum production struggles to keep up with growing demand, and as world population continues to grow, it is unlikely that world per capita production can ever again rise to the levels reached in the 1970s.Alternatives to oil and gas as a source of energy to just feed the world population -- currently dependent on fertilizer (obtained by energy intensive nitrogen synthesis) -- will be way more expensive.
Sure, the phrase "alternative energy" has supplanted "energy independence", but their realities are similarly a combination of magic and fantasy. Nuclear fusion has been worked on since before 1950, but there are no applications in sight. Wind and solar are expensive even after decades of development. Energy companies exploit the energy fog with the claim that there is more than enough for this century (ignoring the climate change impacts as a detail) as if humanity does not need energy later - likely because human-ingenuity will solve that 'detail'.
Economists have not belabored these factoids (similar to physicians avoiding the world's population explosion). Alternatives to oil and gas that do not add to global warming are far off. The entire population of Nauru applied to relocate to Australia when selling off their phosphates winded down. Unlike the population of Nauru we cannot even consider relocating humanity to another location - another planet.
The essence of this topic, already observed in antiquity, is known as the "Tragedy of the Commons" [Tragedy]; Aristotle wrote:
For that which is common to the greatest number has the least care bestowed upon it.
In short we claim that the GDP metric used to make, for example, adjustments in interest rates to tune an economy is misused as a yardstick to measure a nation's economic well being. To reiterate: adding up 'good' and 'bad' economic activities does not make sense.
Way worse, however, is not using a balance sheet like metric, which permits to have scant concerns about the needs of the future generations.
Many additional metrics have been developed as described in [Talberth2], his table lists:
| Economic Objective | Sample Indicators and Desired Direction of Effect | Description |
| Genuine human progress | Genuine progress indicator (+) | Aggregate index of sustainable economic welfare |
| Happy planet index (+) | Aggregate index of well-being based on life satisfaction, life expectancy, and ecological footprint | |
| Well-being index (+) | Aggregate index of well-being based on health, wealth, knowledge, community, and equity | |
| Human development index (+) | Aggregate index of well-being based on income, life expectancy, and education | |
| Renewable energy platform | Carbon footprint (-) | Provides spatial and intensity measures of life cycle carbon emissions |
| Energy return on investment (+) | Ratio between energy a resource provides and the amount of energy required to produce it | |
| Energy intensity (-) | Energy used per unit of economic output | |
| Social equity | Index of representational equity (-) | Measures consistency between ethnic composition of elected officials and that of the general population; zero indicates 'perfect' consistency |
| GINI coefficient (-) | Measures extent to which an income distribution deviates from an equitable distribution; zero indicating 'perfect' equity | |
| Legal rights index (+) | Measures degree to which collateral and bankruptcy laws protect rights of borrowers and lenders, scale of 0 to 10. | |
| Access to improved water and sanitation (+) | Percent of population with access to improved water and sanitation services | |
| Protect and restore natural capital | Ecological footprint (-) | Ecologically productive land and ocean area appropriated by consumption activities |
| Genuine savings (+) | Net investment in human-built and natural capital stocks adjusted for environmental quality changes | |
| Environmental sustainability index (+) | Weighted average of 21 separate environmental sustainability indicators | |
| Economic localization | Local employment and income multiplier effect (+) | Direct, indirect, and induced local economic activity generated by a given expenditure |
| Ogive index of economic diversity (-) | Measures how well actual industrial structure matches an ideal structure; zero indicates 'perfect' diversity | |
| Miles to market (-) | Average distance a group of products travels before final sale |
Regarding the 'Ecological footprint' metric, Talberth quotes from the Global Footprint Network in [Talberth2]:
"our footprint exceeds the world's ability to regenerate by about 25%," implying that we need 1.25 Earths to sustain present patterns of consumption.A most simple metric can be defined based on the statement in [Meadows] that sustainability was surpassed with a world population of 4B:
Given this abundance of alternative metrics, it is intriguing why politicians ignore them and keep being blinded by GDP. The Democracy chapter revisits this topic.
Given our criteria for proper government - as sketched in the previous paragraph - the inference is that governments are seriously handicapped - blindfolded if you want. Hence the question what economics based methods are being used instead by governments and politicians to guide nations. GDP and many other flux-based indexes are available indeed. They provide the 'temperature' of many real-time phenomena. This allows quick intervention to prevent depression and attended deflation when the economic flux slows down or accelerates too much. Hence, economic government is predominantly reactive and avoids proactive management at the higher abstraction level described above.
Reactive intervention produces a sequence of small steps that each
has a local rational. There is, however, no guarantee that the
outcome of such a sequence is overall rational. We have seen
examples of these phenomena already:
- Public education masked a decline of average genotypic cognitive
skills
- Healthcare expenditures have grown steadily while delivering - in
the US on average - insufficient quality according to international
comparisons
We proceed by giving more examples where economic rational has
failed.
Issuing bonds is a short-term solution that shifts a problem to the future. Such a solution appears, to us, an acceptable approach, provided that the reverse would happen as well: when the economy is expanding, use unexpected tax revenue to pay off long-term debts. Paying off debts has indeed a dampening effect on the economy (i.e. shrinking GDP), but this is acceptable given our assumption that the economy was expanding.
Paying off debts (different from refinancing/ rollingover debts) never happens. Hence the rhetorical question: why don't we have responsible politicians that can keep their hobbies in check and strive for a zero debt society instead of spending other people's monies?
Again we conjecture that an assets-debits metric would help reign-in shifting obligations to the future.
- Lodging taxes (10%+ these days) levied on those who are not represented,
and what does the traveler get for these taxes anyway?
- Tobacco, alcohol and gambling taxes to help finance, say, public
education. The dependency on the revenue from 'bad' sources blocks
subsequent legislation against these vices.
- Vector control tax: a convoluted description for using helicopters
to locate not maintained swimming pools in which West Nile virus
carrying mosquitoes are breeding.
- Mental health tax: a tax in California on those earning more than
$1M/year to help fund psychiatric services. (Are these people causing
too much envy, which needs treatment?)
- CO2 tax, yet another tax for those driving a vehicle.
- Tire recycling fee, to be paid when buying a tire.
- Electronic waste processing fee, to be paid when buying a computer
or the like.
- iPod music down load fee, which was considered by NY State
to deal with decreasing tax revenues due to the 2008 collapse of
Wall Street companies.
- Amusement tax on life performances.
Hopefully you are still amused by the creativity of our politicians.
We are not done yet. Allan Shepherd alerted us to marriage licensing. He wrote:
Civil marriage was introduced as an alternative having to cede sole power of solemnizing marriage to the church (in civil England). Then the government found they could make some tax money by issues licenses to perform civil marriages (utterly bizarre concept - licensing someone to marry).We learned recently that a marriage license granted a right that was affixed to the house with the text "Fornication Under Consent of the King", from which a well-known verb has been derived.
Having a pet? You are invited to obtain a pet license. You create a company? Good. In one state you pay $100/year. In another state you pay $800/year. There is no difference in benefits for the company. Why a license fee is required is not clear because companies have also their own income tax. The latter is really strange because, while people ultimately pay taxes for the benefits provided to them, a company, an abstraction anyway, does not obtain any benefits.
An easy example of a problematic tax is the one on gasoline. The
price differential between the price of gas in the US and in the EU
shows that the magnitude of the topic is way more pronounced in the
EU, but lets ignore this observation. The problems with this tax are
the following:
-- The government becomes dependent on the revenue to provide (social)
services.
-- Oil is a finite resource, which usage must be discouraged.
-- Gasoline is a major contributor to the waste product of CO2, which
is the main source for global warming and thus there is a second
reason for discouraging its use.
The government is, however, paralyzed to enforce oil conservation due to its dependence on its revenue.
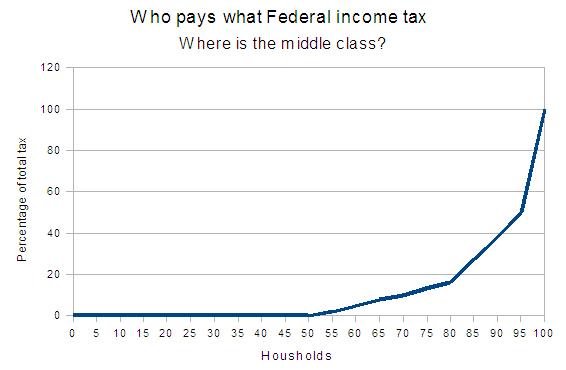
The situation is actually more problematic. Governments in 1900 played a small role in assisting the survival and well being of its citizens. Charity took care of those falling on hard times, which are estimated to be around 10-15% of the population. The role of Government was restricted to maintaining law and order, provide decent infrastructure and maintain a credible defense. Income tax was created for financing war activities and was abolished when the peace returned. The situation is qualitatively different now. The US Government and states finance, in addition, public education, 50+% of the nation's healthcare expenditures and a host of other social assistance programs. This is all paid for by income taxes on individuals and companies. This is all OK, until one asks the question who pays what. Obviously, not everyone pays the same fees for membership of the society. Here the hard-nosed data for 2007:
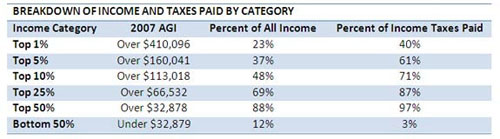
Is that a problem? Not from the perspective of the great majority of citizens in the society. A citizen feels fine, by and large, as long as he or she can pay the bills. Economic self-sufficiency is a macro economic abstraction, which is not part of the normal discourse anyway. The problem resides in the government. A nation's economy getting a bout of the flu - a small depression - is sufficient to cause havoc in the tax revenue stream and thereby in how to keep social services afloat on which most citizens depend. In addition, it causes a reduction of the workforce that delivers and regulates these services. This deepens the depression due to a decrease of the demand for consumer goods. Thus the larger fraction of the citizens lacking economic self-sufficiency increases the instability of the economy.
We have anti-trust laws and we keep a weary eye on monopolies, but we have not been able to prevent governments to become massive monopolistic financial redistribution centers.
Our income-expense metric would (with some addition?) call-out the disproportionate role of the welfare state governments.
The story of a minority being taxed to support a majority repeats itself at the level of US states:
| Federal Spending in Each State Per Dollar of Federal Taxes; FY 2005 | ||
| State | Federal Spending per Dollar of Federal Taxes | Rank |
| New Mexico | $2.03 | 1 |
| Mississippi | $2.02 | 2 |
| Alaska | $1.84 | 3 |
| Louisiana | $1.78 | 4 |
| West Virginia | $1.76 | 5 |
| North Dakota | $1.68 | 6 |
| Alabama | $1.66 | 7 |
| South Dakota | $1.53 | 8 |
| Kentucky | $1.51 | 9 |
| Virginia | $1.51 | 10 |
| Montana | $1.47 | 11 |
| Hawaii | $1.44 | 12 |
| Maine | $1.41 | 13 |
| Arkansas | $1.41 | 14 |
| Oklahoma | $1.36 | 15 |
| South Carolina | $1.35 | 16 |
| Missouri | $1.32 | 17 |
| Maryland | $1.30 | 18 |
| Tennessee | $1.27 | 19 |
| Idaho | $1.21 | 20 |
| Arizona | $1.19 | 21 |
| Kansas | $1.12 | 22 |
| Wyoming | $1.11 | 23 |
| Iowa | $1.10 | 24 |
| Nebraska | $1.10 | 25 |
| Vermont | $1.08 | 26 |
| North Carolina | $1.08 | 27 |
| Pennsylvania | $1.07 | 28 |
| Utah | $1.07 | 29 |
| Indiana | $1.05 | 30 |
| Ohio | $1.05 | 31 |
| Georgia | $1.01 | 32 |
| Rhode Island | $1.00 | 33 |
| Florida | $0.97 | 34 |
| Texas | $0.94 | 35 |
| Oregon | $0.93 | 36 |
| Michigan | $0.92 | 37 |
| Washington | $0.88 | 38 |
| Wisconsin | $0.86 | 39 |
| Massachusetts | $0.82 | 40 |
| Colorado | $0.81 | 41 |
| New York | $0.79 | 42 |
| California | $0.78 | 43 |
| Delaware | $0.77 | 44 |
| Illinois | $0.75 | 45 |
| Minnesota | $0.72 | 46 |
| New Hampshire | $0.71 | 47 |
| Connecticut | $0.69 | 48 |
| Nevada | $0.65 | 49 |
| New Jersey | $0.61 | 50 |
| District of Columbia | $5.55 | na |
| Source: Tax Foundation, Census Bureau | ||
A majority of the states, 64%, receives more from the Federal Government than they send in to Washington. This discrepancy has not happened overnight. Clearly, there are no mechanisms in place to force a state to live within its means.
One cannot expect that all taxpayers contribute at least the amount that they receive in the form of social services. It is unclear, however, why states are allowed to be 'parasites'. This absolves them of enforcing financial discipline on their constituents and could be part of the reason why the national income distribution is so skewed. Moreover, each state is the beneficiary of national services: defense being the obvious example. Hence, one would actually expect that each state would contribute more to the Federal Government than what they receive.
We found a publication from an author (who's identity will not be disclosed in this chapter) who described a decade ago several future scenarios. Some of these scenarios are too far out, but this one looks noteworthy:
For instance, it may be that machines will take over most of the work that is of real, practical importance, but that human beings will be kept busy by being given relatively unimportant work. ... Thus people would spend their time shining each other shoes, driving each other around in taxicabs, making handicrafts for one another, waiting on each others tables, etc.The current situation may not be as bleak as what that author paints; still we appear to go in that direction. The anonymous author blames technology push for the emergence of that scenario. However, Information Technology (IT) is 'only' the next turn of the crank of the Industrial Revolution. The inability to adjust too higher levels of automation is certainly noteworthy.
Still there are more factors. The GPI graph above showed stagnation and a slow decline starting around 1973. The US switched at that time from being oil self-sufficient to having to import it from the Middle East and hence having to surrender a part of its manufactured products to pay for the imports. The US's population was around 220M in 1973. Thus the switch to a knowledge driven economy - to squeeze out more yield - was caused by slowly emerging physical resource limits. Productivity increases could not keep up with the population increases, while only a minority of the population was able to profit from the IT developments.
Globalization - taking off since 1994 with the NAFTA agreement - has also been blamed for deterioration and growing unemployment, especially since the 2008 economic turbulence. The question whether the US (and in fact every other country) can support an unlimited number of jobs (with 300M people in 2000) is, however, never pondered. In other words, it is a miracle that the US has been able to provide employment while its population grew from 76M in 1900, 161M in 1950 to over 300M in 2010. Whether this development was the best of all worlds and whether we will have to pay now for this explosion is another matter, to be discussed further down.
The transition from a large majority in 1900 being economically self sufficient to a small minority these days has been a slow creeping process, which never got any attention. Nearly everyone still thinks that they pay through taxes for the social services they receive. When confronted with the numbers mentioned above reactions range from extreme disbelief to the opposite assertion that it has always been the case that only a minority was economically self-sufficient.
The appendix "Data regarding the bottom of the US society" shows for the bottom 40% and 60% of the US society what their share was of US net worth and income in the period of 1983-2004. On both dimensions there is a steady decline.
Solidarity is the foundation for helping those in need. The way we have been doing that has very slowly increased the need for help. The key issue here is: what did we do wrong and how can we do better?
The Wikipedia explanations for inflation are quite obtuse, [inflation], but it does have a remarkable reference to the period 1666-2004, [inflation2]. Its graph invalidates our statement that prices always go up. Inflation was positive and negative between 1666 and 1950 with rapid and large swings. The up and down fluctuation stopped in 1950 and inflation has been positive since then with a peak in the 70-ties at 14%.
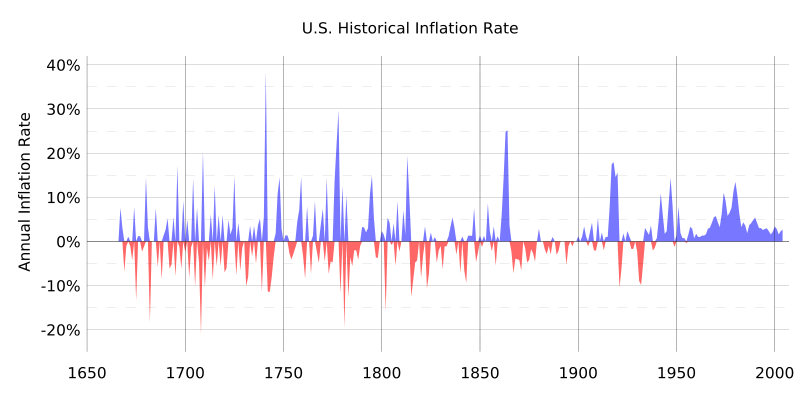
Here our 1-cent theory for the recent history. Population increases, demand goes up and thus prices increase. Yet another 1-cent theory is that the world economy is running on oil, a finite resource which takes more and more effort to produce, hence its price rises and thereby all other products and services. It turns out that the first one has the official label "demand-pull inflation" and the second one has the label "cost-push inflation".
Demanding zero inflation as a policy goal is not realistic - as suggested by our 2-cent theories. Problematic, however, is how governments exploit inflation by passing legislation with references to fixed amounts. A typical example was estate tax (death tax), which kicked in above $600,000. That amount was not adjusted for decades, which produced automatically higher revenues each year. Income tax brackets that do not get adjusted give the government similarly a free ride. The amount one can give to someone tax-free was fixed at $10,000 for decades. Same story for the amount one can import and export without having to declare it. Terrible legislation.
Even worse is taxing the interests on savings accounts and similar instruments because the inflation rate is typically higher than the interest rate and thus saving money implies loosing it. Similarly, inflation can have eliminated the gains of long held stocks on which one still must pay capital gains taxes. Both of these are disincentives for savings, and indeed the US saving rate beats records - in going lower most of the time.
Quantitative easing is risky because it can lead to hyperinflation. It has been tried repeatedly in Japan during 1990-2010, and it did not work. Global, structural problems may have surfaced early in Japan due its reliance on export.
Our concern here about quantitative easing is that it avoids dealing with potentially deep, structural problems. An economy that does not respond to near zero interest rate has apparently no productivity improvements, may have lived beyond its means, and/or has unrecognized deficiencies. The US ignoring the lessons of Japan, while not really recovered from the dot-com collapse and trying (2010) quantitative easing to climb out of yet another economic hallucination is likely ignoring its own structural problems and is just postponing dealing with reality.
We provided statistics in the Healthcare chapter that the average person in the US, the Netherlands and plausibly in all welfare states, receives more in social services than what is paid in taxes. The data in the who-pays-what table above shows the same. This leads to the unusual conclusion that the middle class is not a majority anymore. Actually, when one stares longer at the who-pays-what table it is not clear whether a middle class still exists. Only the 80-100% segment pays more than their proportional share of the population.
The simulation study is based on a world model (World3) developed around 1970 [Meadows]; the red 'world oil production' graph is a later addition. The simulation study has not been taken serious. The authors themselves warned that innovations could invalidate the trends described by their model. The press and the politicians were sure enough that human ingenuity would make this model irrelevant. However, only minimal changes to the model have been required since then. We are now nearly 40 years later and instead of breakthroughs we witness slow declines in the West, while catch-up, me-too progress elsewhere decimates the world's resources even faster.
See the chapter titled "Dennis Meadows" for more discussion. Results of newer runs with the World3 model are presented in the chapter titled "World3 Again".
The GDP metric is useful indeed to measure the sum total economic flux in a society, but does not capture a nation's ability for Discretionary Expenditures, which are essential for avoiding a hand-to-mouth economy. A metric corresponding with a company's balance sheet is lacking as well, which allows us to proceed with unsustainable economic practices.
Hence, we need these additional metrics - as sketched in this chapter - to guide macro-economic decision making, to correct our current, delusional practices.
[Cobb] Cobb, C., T. Halstead & J. Rowe, "If the GDP is Up, Why is America Down? Atlantic On Line", 1995 October, http://www.theatlantic.com/politics/ecbig/gdp.htm
[Cobb2] Cobb, C., G.S. Goodman & J.C. May Kliejunas, "Blazing Sun Overhead and Clouds on the Horizon", http://www.rprogress.org/publications/2000/gpi1999.pdf
[GDP] http://en.wikipedia.org/wiki/Gross_domestic_product
[inflation] http://en.wikipedia.org/wiki/Inflation
[inflation2] http://en.wikipedia.org/wiki/Image:US_Historical_Inflation_Ancient.svg
[Meadows] Meadows, D., J. Randers, & D. Meadows, "Limits to Growth, The 30-Year Update", Chelsea Green Publishing Co., 2004.
[Middle class] http://en.wikipedia.org/wiki/Middle_class
[Noah] Noah, T., "The Great Divergence", Slate, 2010 Sept 3, http://www.slate.com/articles/news_and_politics/the_great_divergence/features/2010/the_united_states_of_inequality/introducing_the_great_divergence.html
[Talberth] Talberth, J., C. Cobb, N. Slattery, "The Genuine Progress Indicator 2006", 2007 February, http://www.rprogress.org/publications/2007/GPI2006_ExecSumm.pdf
[Talberth2] Talberth, J., "A New Bottom Line for Progress", Chapter 2 in STATE OF THE WORLD 2008, http://www.rprogress.org/publications/2008/A%20New%20Bottom%20Line_SOW08.pdf
[Tragedy] http://en.wikipedia.org/wiki/Tragedy_of_the_commons
[Wolff] Wolff, E.N., Recent Trends in Household Wealth in the United States: Rising Debt and the Middle-Class Squeeze, Working Paper no 502, The Levy Economics Institute of Bard College, 2007 June.
| Percentage of Share of Net Worth | |||
| Year | Bottom 40% | Next 20% | Bottom 60% |
| 1983 | 0.9 | 5.2 | 6.1 |
| 1989 | 0.7 | 4.8 | 5.5 |
| 1992 | 0.4 | 4.4 | 4.8 |
| 1995 | 0.2 | 4.5 | 4.7 |
| 1998 | 0.2 | 4.5 | 4.7 |
| 2001 | 0.3 | 3.9 | 4.2 |
| 2004 | 0.2 | 3.8 | 4.0 |
| Percentage of Share of Income | |||
| Year | Bottom 40% | Next 20% | Bottom 60% |
| 1982 | 12.3 | 14.2 | 26.5 |
| 1988 | 10.7 | 13.2 | 23.9 |
| 1991 | 10.5 | 12.8 | 23.3 |
| 1994 | 10.7 | 13.6 | 24.3 |
| 1997 | 10.5 | 12.8 | 23.3 |
| 2000 | 10.1 | 12.3 | 22.4 |
| 2003 | 10.2 | 12.1 | 22.3 |
Progressive taxation and massive transfers through free/ subsidized social services did not prevent the bottom to slip percentage wise on both dimensions. Automation, non-linearity of the jobs-population function when the population increases, decrease of cognitive skills, etc. are all candidate explanations for the declines of the share ratios of net worth and income in the bottom 60%. Since the labor market works fine, postulating nefarious maneuvers is not realistic - we believe.
We want to go into more detail what happened since 2002: the so-called financial meltdown. At least the following parties participated in this saga:
Lets conjecture that a national assets-debits metric would have shown at an earlier stage the saturation of the housing market.
The author, Timothy Noah, meanders through a sequence of conjectures trying to explain why the top 10% has increased its share of the US national income since 1977. In turn, he looks at a wide range of candidate explanations. We list his items and summarize his conclusions.
Race Blacks have basically been holding their share.
Gender Woman's lot has been improved: "... the male-female wage
gap has shrunk by nearly half."
Breakdown of the nuclear family This item has "virtually none"
contribution to the divergence.
Immigration Noah hedges his opinion on this hot potato with
"... Is it the most important contributor? No.". A summary gives,
however: "Immigration is responsible for 5 percent" (of the Great
Divergence), without a justification of the '5'.
Technology boom Noah claims that the computer revolution
resembles previous technology advances in which displaced workers
found new jobs higher up.
Federal government policy Noah devotes many paragraphs to
taxation shifts, which has nothing to do with income share changes.
Increased lobbying activities is brought up as well. Still impact on
the Divergence is not articulated.
Decline of labor unions This item also does not yield a
contribution to the Divergence, to the extend we understand
the endless, elaborate detours.
International trade China does replace low level labor in the
US in the first decade of the 21st century but Noah appears to doubt
it to be significant for the topic of the since 1977 developing
Divergence.
The ultra wealthy The item is whether the ultra wealthy (top
0.1%) are to be blamed for the Great Divergence. Noah appears to deny
this with: "Having a job - the right job, anyway - became the way to
get posh. That's encouraging in one sense: To roll in the dough you now
have to work for a living."
The decline of K-12 education Noah admits that education plays
somehow a role as seen in the following quotes:
"At a time when the workforce needed to be smarter, Americans got
dumber. Or rather: Americans got smarter at a much slower rate than
they did during previous periods of technological change ...".
Hence the few with the right skills
"... bid up their salaries. It was terrible news for everyone else."
And Noah adds "... it represents a failure by elementary and secondary
schools to provide education relevant to the economy's growing demands
..."
Noah claims the main culprits to be:
- "Wall Street and corporate boards' pampering of the Stinking
Rich"
- "Various failures in our education system"
The first culprit has to do with a few thousand CEOs, CFOs, CIOs, etc., in the top 1% who takes 20% of all income, but does not apply to the next 19% who takes 34% of all income (2010 data).
The second culprit blames the education system but does not consider the inability to school displaced workers and a new generation at a higher level due to insufficient cognitive skills of the recipients.
Questionable is Noah's position that the technology boom did not play a role with his assertion: "If computers required ever-higher levels of education to manipulate ever-growing quantities of information in ever-more rococo ways, then we'd expect the very richest people to be the biggest nerds. They aren't." Many of the rich people actually created hardware and software companies and they created employment with high paying jobs.
The long article's last paragraph is:
What is the ideal distribution of income in society? I couldn't tell you, ... But I can tell you this: We have been headed in the wrong direction for far too long.Certainly. Mr Noah suggests that his analysis concerns the nation's share of the incomes of the top 10%. However, his arguments pertains to the usual gripes about the top 1% with their 'absurd' high incomes (especially the 'bad' CEOs, who get 'too generous' payouts when they are dismissed by their boards). He does not explain why the next 9% have their disproportionate high share of 34%. He confuses his topic by switching midstream from high income to high net worth and he reduces his credibility by referring to those in the second, out of scope, category with "Stinking Rich".
We miss in Noah's deliberation considerations about the bottom 270M people segment. His inattention masks, in our opinion, what is going on in the bottom 50% of the society, where, at last count, their households do not pay Federal income tax. Instead of asking the, valid, question why the top 10% saw its income share increase in 30 years from 34% to 48%, we can ponder the equally valid question why the share of the bottom 90% decreased from 66% to 52%. It is unclear, to us, why the latter question is not raised.
There are other factors that are ignored by Noah. The US population grew from 220M in 1977 to 308M in 2010. Why do we always assume that (quality) employment scales with population increases? The World's population grew from 4B in 1975 to close to 7B in 2010. The population outside the US claimed their share of the World's resources and that share increased in addition due to their me-too economic activities. Both of these developments put pressure on the resources available to the US population. Noah admits that schools failed to provide "... education relevant to the economy's growing demands ...". It is not pleasant indeed to have to ponder that the US's Great Divergence has its roots in the bottom part of the US society (see the first Appendix) and in developments outside of the US.